Using Prometheus and Grafana for Advanced Monitoring

In today’s tech landscape, where server uptime and performance are critical to user experience and operational efficiency, effective monitoring tools have become essential. Prometheus and Grafana are two powerful, open-source solutions that together offer a robust platform for real-time monitoring and visualisation. Prometheus provides precise, customisable metrics collection, while Grafana brings these metrics to life with rich, interactive dashboards. This combination not only helps identify and resolve issues before they impact users but also enables data-driven insights to optimise performance and prevent future bottlenecks. If you're managing infrastructure, scaling applications, or just looking to maintain a healthy server environment, Prometheus and Grafana are indispensable tools to consider.
My instance is installed inside of a Debian 12 VM with 2 cores, 4GB RAM, a 32GB boot disk and a 256GB disk for storing historic Prometheus data. If like me, you created a data disk for Prometheus, you'll want to mount this at /var/lib/prometheus before going any further.
Prometheus
To get started, lets get Prometheus installed and configured.
sudo apt update
sudo apt install prometheus
Once installed, if you created a data disk you'll need to tell Prometheus how much data it is allowed to store...
sudo nano /etc/default/prometheusIn this file you should see ARGS=""
Edit this so that it shows the following making sure to change the amount of storage to just short of the total disk size for the data disk.
ARGS="--storage.tsdb.retention.size=250GB"This will mean that Prometheus will store data up until the amount specified becomes full at which point it will start to purge the oldest data to make way for the new.
Will this in place, restart Prometheus...
sudo systemctl restart prometheusNext, you'll need to tell Prometheus what systems you want it to collect metrics from. This is done in the config file located at /etc/prometheus/prometheus.yml - edit this file...
sudo nano /etc/prometheus/prometheus.ymlIn this file, look for scrape_configs:
Underneath this, add the following to start creating your first group of hosts. I like to split mine up into Windows and Linux. Note, Linux runs on port 9100 and Windows runs on 9182 by default.
  - job_name: linux
    static_configs:
      - targets: ['testserver:9100']
Where I've said testserver above, this would be the DNS name of your server or IP address.
For additional hosts just duplicate the line starting - targets:
When you make changes to this file, you'll need to restart Prometheus...
sudo systemctl restart prometheusYou should then have a web interface opened up on port 9090.
If you access this and go to Status -> Targets you should see the servers you entered above.
You'll then need to install and run the Prometheus Exporter on these servers so that they show as up and Prometheus can start collecting metrics.
Linux
For Linux, it's just a case of running these two commands...
sudo apt install prometheus-node-exporter
sudo systemctl enable --now prometheus-node-exporter
Windows
For Windows, I recommend checking out this project.
Go to Releases on the right hand side, then from the latest release, download and install the msi file. There are various flags that can be ran at the time of installation to enable certain collectors which are all detailed in the readme.
Grafana
Now lets get Grafana installed and configured.
sudo apt install apt-transport-https software-properties-common wget
sudo mkdir -p /etc/apt/keyrings/
wget -q -O - https://apt.grafana.com/gpg.key | gpg --dearmor | sudo tee /etc/apt/keyrings/grafana.gpg > /dev/null
echo "deb [signed-by=/etc/apt/keyrings/grafana.gpg] https://apt.grafana.com stable main" | sudo tee -a /etc/apt/sources.list.d/grafana.list
sudo apt update
sudo apt install grafana
The main config file is at /etc/grafana/grafana.ini
The main configuration is detailed here.
In my instance, I've set the hostname and SMTP. That's about it.
Once done, enable and start the service using this command...
sudo systemctl enable --now grafana-serverWith that done, access the web interface on port 3000 by default.
The default login is admin and admin
Once logged in, I recommend creating a new user with full admin permissions, then logging in as this user and deleting the default admin user.
Linking the two systems together
Now we'll connect Prometheus to Grafana so that we can start creating alert rules and pretty dashboards.
In Grafana, on the left hand side go to Connections, then Add new connection.
From the list, choose Prometheus.
Then Add new data source.
The only value you'll need to change here is Prometheus server URL.
This should be set to http://127.0.0.1:9090
Finally click Save & test at the bottom.
Dashboards
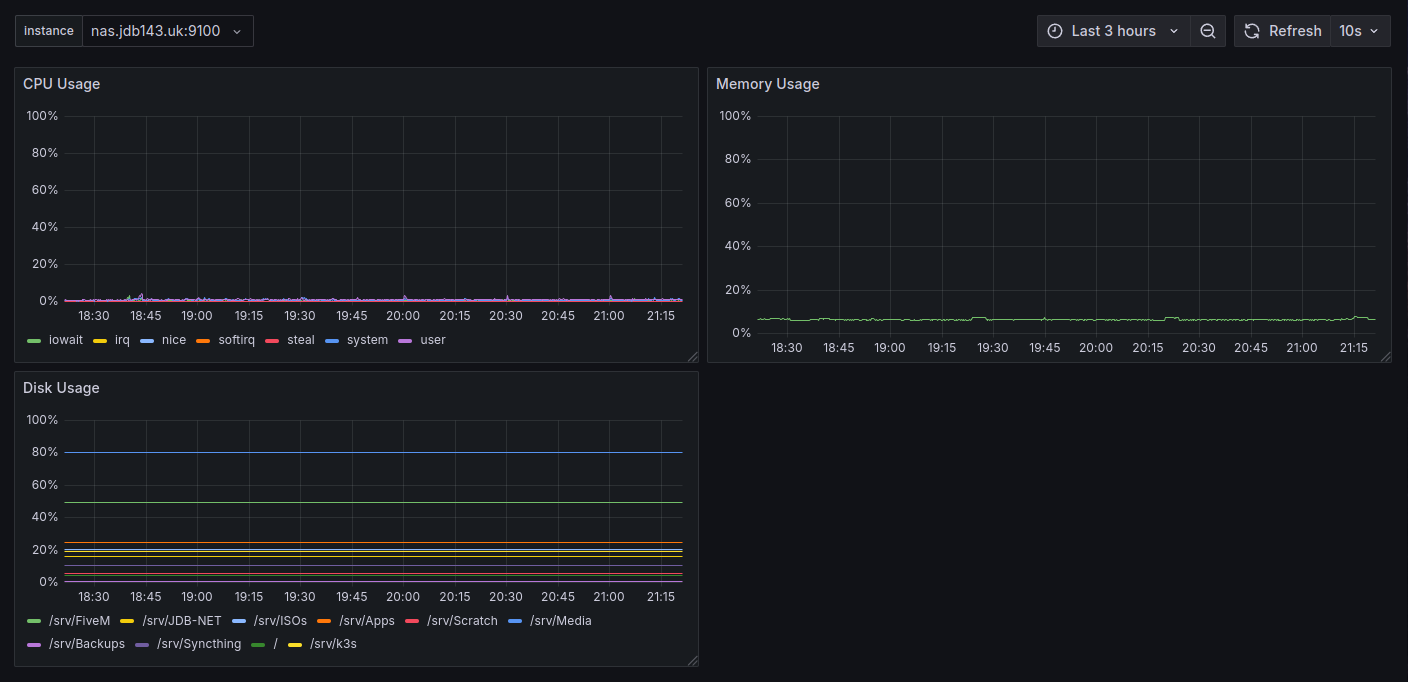
So you're now probably going to want putting together some nice dashboards. The best place to start with this is on Grafana's website where they have loads that other users have created. This is also the best way to learn how to create your own as you can see how others have created theirs.
Here's an example of one that I've created...

Alerting
One of the more useful features that Grafana offers is alerting. It can be split up into two parts, alert rules and contact points. Contact points are quite simply ways in which Grafana will alert you. For example, it could email you or send an alert in your Discord server. You can find a long list of supported integrations here.
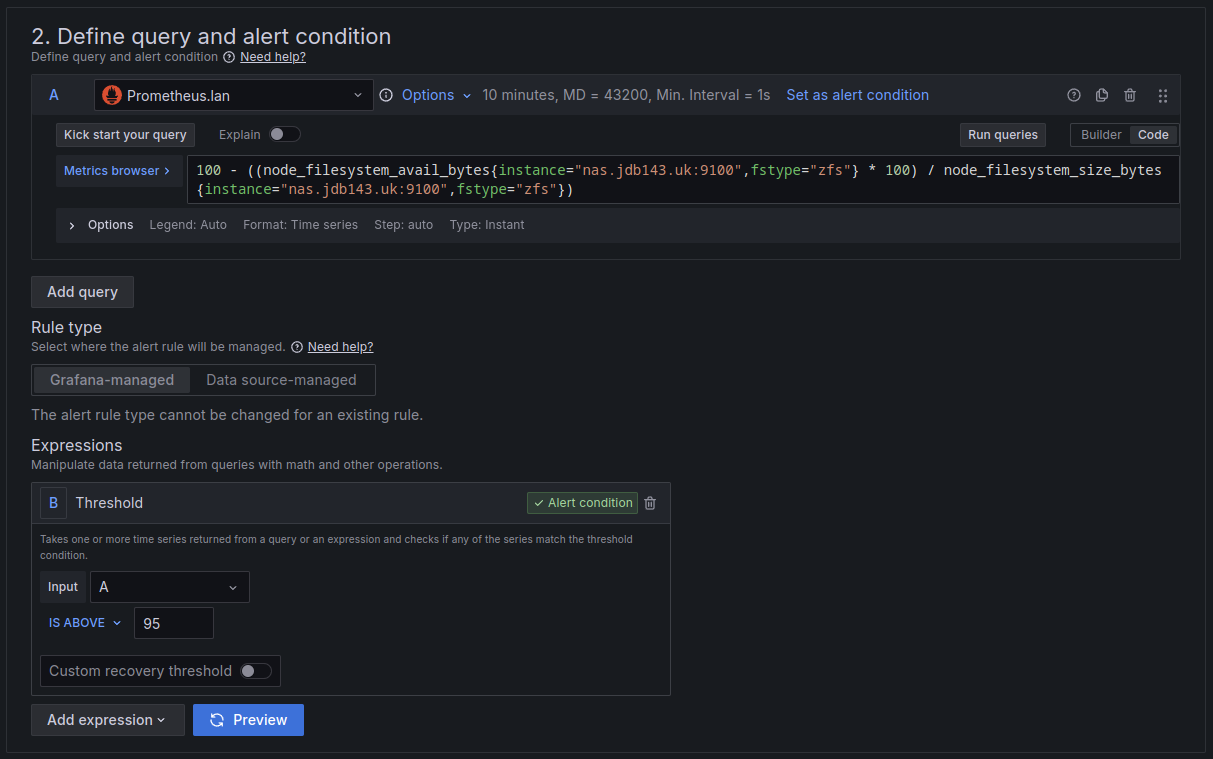
Now onto alert rules, these are essentially the conditions you set that when they fail you will then be alerted. For example, if the disk usage on one of my servers goes above 95% then I will get an alert telling me the disk is getting full.
To begin, you first set the name of the alert, mine is set to NAS disk full. This will be what the alert tells me. Next, you have the query. In this case it looks like this...
100 - ((node_filesystem_avail_bytes{instance="nas.jdb143.uk:9100",fstype="zfs"} * 100) / node_filesystem_size_bytes{instance="nas.jdb143.uk:9100",fstype="zfs"})You then want to add an expression that says If A (being the query above) is above 95 for a certain period, then alert me. This is what the end result looks like...

Finally you need to set the pending period, then the contact point mentioned earlier.
To test this rule, you could set the threshold to above 10 for example which would mean above 10%.
That's it, there's the basics of installing Prometheus and Grafana, configuring them to work together, then creating some basic dashboards and alerts.


